In machine learning (ML), model performance is affected by both the data, and the learning algorithm you choose. In general, you would expect the more (good) data collected, the more information you could extract and the better your model could perform. However, there exists a saturation point where model performance stops improving even with additional data. This saturation happens when the size of the data cannot help a model surpass the assumptions of the learning algorithm. For instance, when a linear model is used to classify data within which nonlinear relationship resides, perfect prediction will never be reached, even with a lot of training data.
Let’s take a closer look at an example of how training data size affects ML model performance.
In online advertising, it’s critical to estimate the probability a user will respond to an ad (either click or conversion). This probability indicates the user’s interest in a product or brand and obtaining an accurate prediction improves both the user experience, and effectiveness of the advertising campaign. When predicting click-through rate (CTR), linear algorithms like Logistic Regression (LR) are often used, and here we’ll look at how data size affects LR performance. We also have a look at the results for Factorization Machines (FM) – an efficient algorithm to add cross features to LR. Here, we concentrate on the effect of data size on model performance, and leave the performance comparison between LR and FM to a separate post.
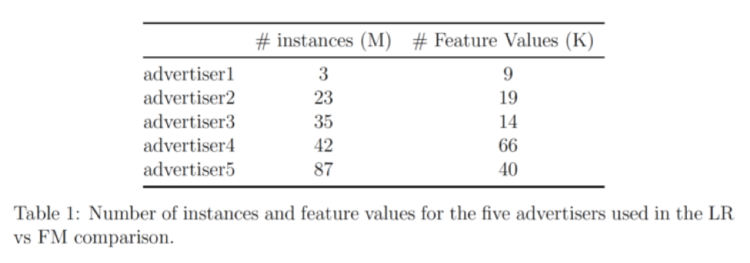
Our data comes from 5 advertisers; the table below shows the number of entries and number of features for each:

This data set is preprocessed and randomly sampled into data groups with different sizes. Then LR and FM are separately applied to each data group to generate classification models, the models are then evaluated on left-out test data sets using AUC scores.
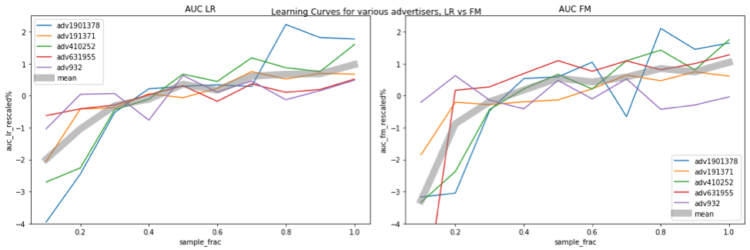
The figures below show the relationship between model performance and data size. The horizontal axis represents the sampling fraction, e.g. 0.1 means 10% of the data is used for training. The vertical axis indicates the model performance (i.e., AUC). The AUC values are at different ranges for different advertisers, and this makes comparison difficult. To have a more clear comparison, we rescale AUC for each advertiser with the following rule:
AUC_rescaled = (AUC / AUC_avg – 1) * 100%
where AUC_avg is the AUC averaged across all sampling fractions for that advertiser.

In the plot, different advertisers are color-coded, and the thick gray curve represents the average re-scaled AUC across all 5 advertisers. Figure on the left and right show the results for LR and FM, respectively. It’s clear that the model performance keeps increasing when more data is used for training, and with the amount of data used in the test, neither LR nor FM reach the saturation levels. One thing worth mentioning is, when we increase the size of training data, the feature space is also expanded, therefore, model complexity increases, making it harder to saturate.
There is also an interesting trend: the AUC increases by about 1% when the data size almost doubles. This relationship is probably clearer if we make a lin-log plot by plotting the x-axis in log scale, and now we see a straight (sort of, at least for LR) gray line, meaning that when we increase x (data size) exponentially, y (performance) increases by a linear amount.

In summary, in our experiment, the saturation point was never met with increasing amounts of data. When the data size doubles, the AUC increases by almost 1%. For industrial applications 1% increase in AUC is often considered a significant improvement. This is to make the case that when there is enough data, increasing training size is a straightforward way to improve model performance.


